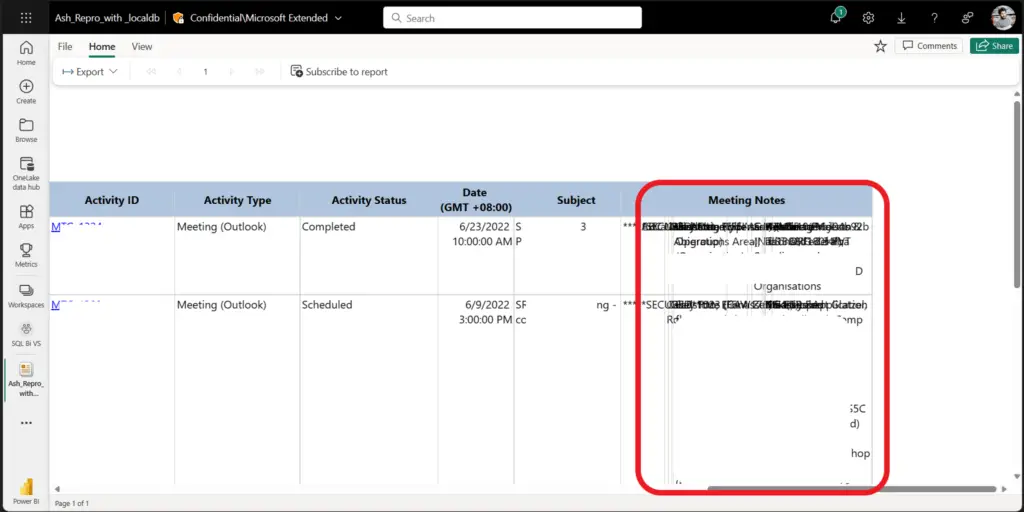
Column Overlapping: The issue is pretty common in Power BI service. When we have multiple column and rows in rdl/paginated report then we get this below kind of inaccurate data or overlapping of rows or column.
About Preview Feature:
This is new functionality which is introduced to give better improvement and performance in the Power BI service, but somehow it doesn’t work in some cases. There are many bug/limitations when the “Preview Feature” is enabled.
Note: By default, the “Preview Feature” will be enabled if you have not made any changes in the toggle/menu bar.
For more details refer: https://learn.microsoft.com/en-us/power-bi/consumer/end-user-preview-features
Problem Scope:
As you can see in this below image, I have one paginated report and when I run this report in power bi service and scroll towards right of this report, then I will get this column overlapping issue/text overlapping.
Resolution for Column Overlapping:
Workaround 1: Since this is paginated report, I will try to run this report in PBIRS (Power BI Report Server) or SSRS (SQL Server Reporting Services). Also, you can render this report in “MS Report Builder” OR “Power BI Report Builder” if you don’t use PBIRS/SSRS in your machine.
This is to make sure that we don’t have any problem or issue in the report. If you are sure that that rdl/paginated report is completely working fine then you can move to 2nd workaround.
As you can see in my case that when I run this report in Report Builder, it works fine without any problem or issue.
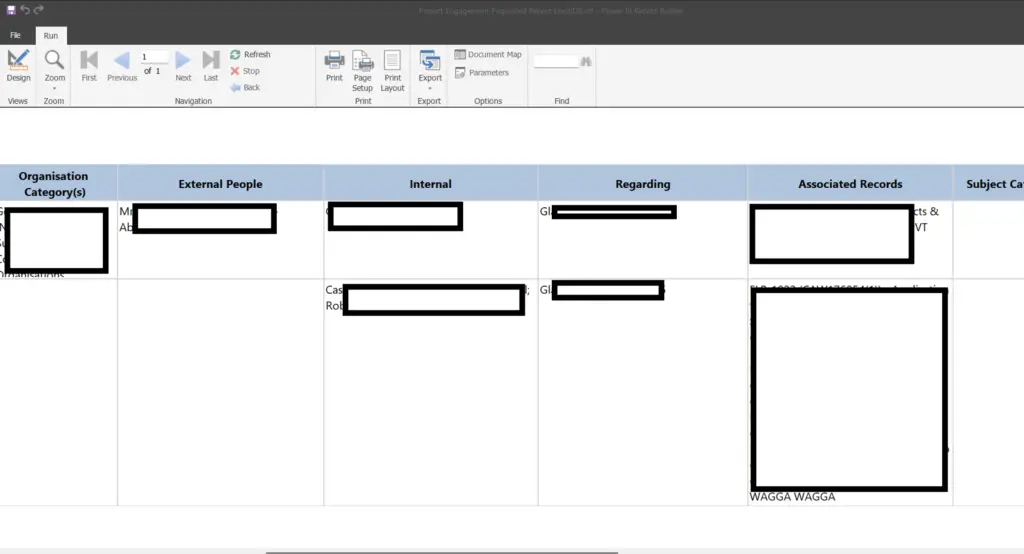
Workaround 2: Now we will disable the “Preview Feature” and check the behaviour in power BI service. To disable the “Preview Feature” please follow the below steps:
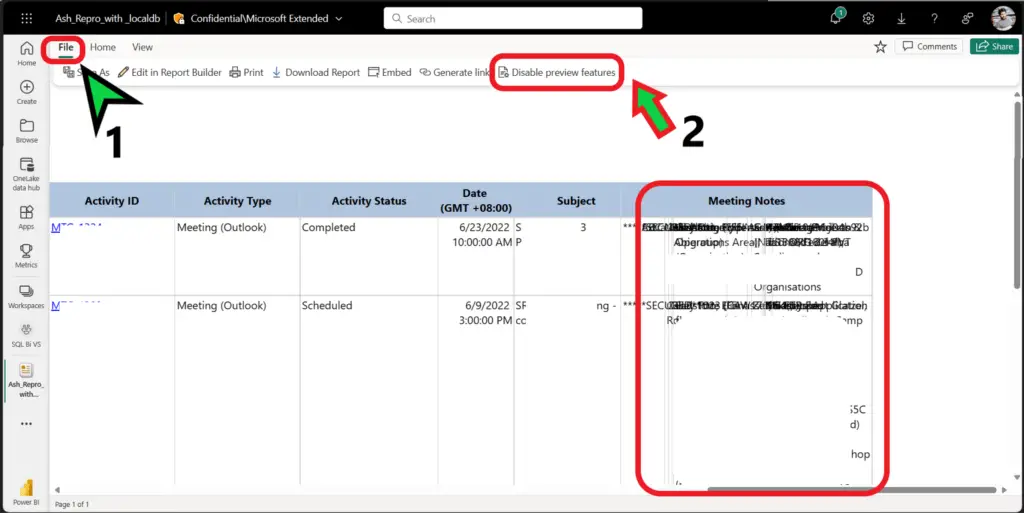
Open the report and go to “File” option as shown in the below image, once you click on file you will find “Disable Preview Feature” Click on that to disable the preview feature to make your report work fine without any issue.
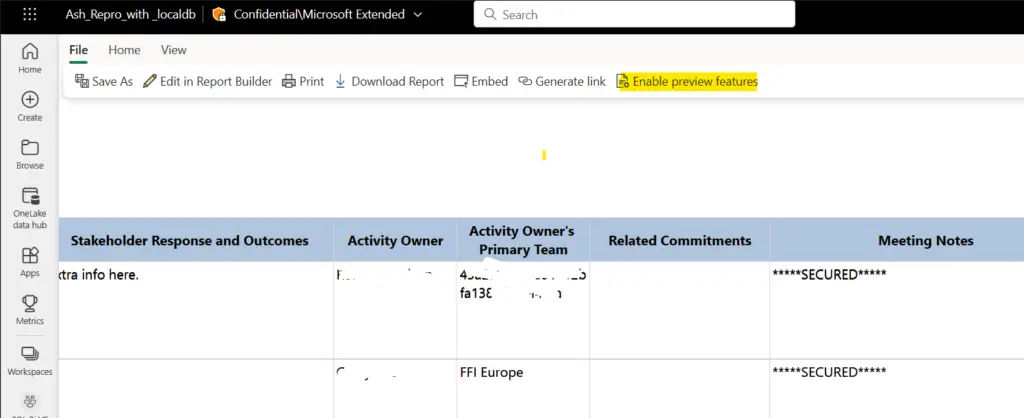
Once you will “Disable Preview Feature” option and re-render the report it will work without any issue
Workaround 3: The other workaround for this issue you can follow the below steps from Power BI Report Builder and publish back to the Power BI Service to check the behaviour.
Step 1: Open the report in report builder and you can see that I have selected the first column to perform the task.

Step 2: Click on the column groups drop down arrow to click Advance mode.

Step 3: Click on the static to show column properties at right side pane and change the FixedData option to False.
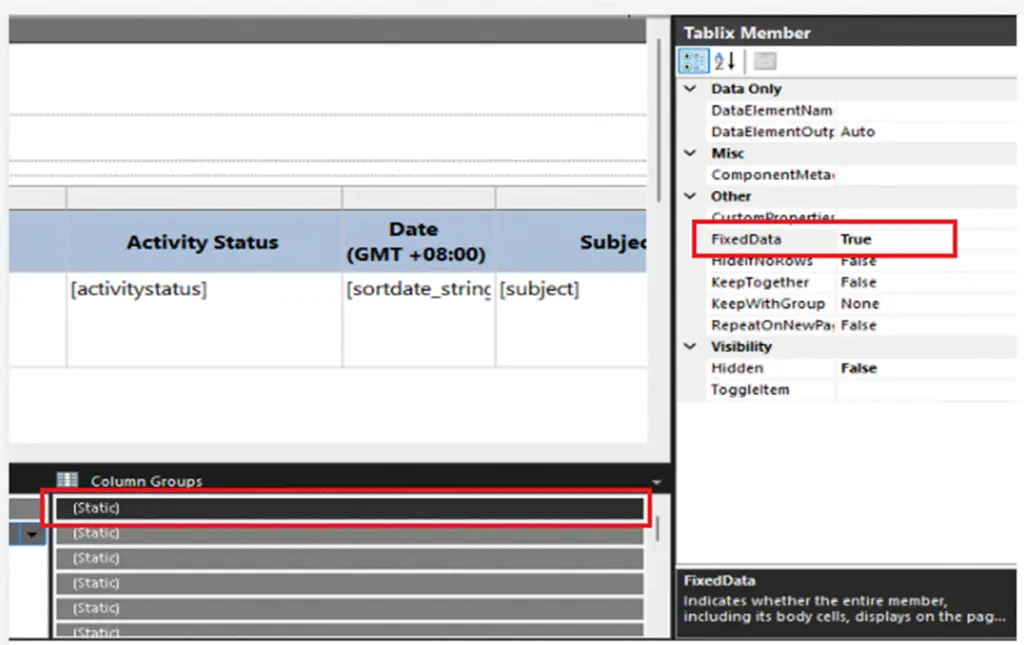
Step 4: Please repeat the step 3 for all the remaining columns(static) which are available at column groups.
Step 5: Save the report and publish back to the Power BI Service and check the behavior and let us know the update.
Remember/Caution:
- Once you disable the “Preview Feature” this will create a browser backup in the backend and will be disabled for upcoming 30 days. But after 1 month it will enable automatically so again you have to disable it.
- Microsoft is actively working on this “Preview Feature” option and will definitely come up with solutions/fix for this issue.
- The “Preview Feature” is not applicable or available for PBIRS (Power BI Report Server).
- The “Preview Feature” is not applicable or available MS Report Builder/ Power BI Report Builder.
- This “Preview Feature” is not dependent on any kind of data source in Power BI Service.
SQL Bi Links:
- Port Number For Analysis Services – Find Ports For SSAS? (kingfishertechtips.in)
- RS.exe Utility: Migrate RDL Reports To Another SSRS/PBIRS (kingfishertechtips.in)
- Direct Query Mode ON In Tabular Model Issue – Visual Studio (kingfishertechtips.in)
- SMTP Server In SSRS/PBIRS |Subscribe To Email Problem/Issue (kingfishertechtips.in)
- SQL Server 2022 Download, Install, Connect Using SSMS Tool (kingfishertechtips.in)
- Creating Tabular Project & Deploy Model To Analysis Service (kingfishertechtips.in)
- Deploy Tabular Project To Azure Analysis Service – SSDT Tool (kingfishertechtips.in)
- SSRS/PBIRS – Install And Configure The Report Server On-Prem (kingfishertechtips.in)
- Could Not Load Folder Contents In Portal URLs – SSRSPBIRS (kingfishertechtips.in)
- SSRS/PBIRS – Install And Configure The Report Server On-Prem (kingfishertechtips.in)
- SQL Server 2022 Download, Install, Connect Using SSMS Tool (kingfishertechtips.in)
- Capture Fiddler Trace for Debugging the Network Traffic (kingfishertechtips.in)
- On-Premises Gateway: Configure/Map SQL DB To Power Bi (kingfishertechtips.in)
- Fixed Column/Row Header Make Visible In Any Report (kingfishertechtips.in)
- Self-Signed Certificate: Configure SSRS/PBIRS With SSL (kingfishertechtips.in)
- Create Local User Account/Local Admin User In Windows 10/11 (kingfishertechtips.in)
- Login With AAD/Domain/Microsoft Account To Azure VM’s/RDP (kingfishertechtips.in)
