Capture Fiddler Trace: Fiddler is a one of the best network tracking tool, where you can capture all kind of https, http, connectivity traffics to analyse the request made to certain application and websites. Capture Fiddler Trace widely used to debug the issue/problems which we will generally face in the network communication levels.
Fiddler?
Capture Fiddler Trace: It is web debugging tool valuable for all kind of OS such as macOS, Windows, and Linux. Monitor all the network traffics on your machine/pc to get best connectivity protocols traces/path for troubleshooting.
You can Install Fiddler Classic from this URL!. If you have not yet downloaded this application and installed it on your PC. Note: Fiddler Classic is free version and it it recommended by Microsoft for dubugging and troubleshooting. For more about this you can click on this this link!
What Fiddler Classic Can Capture?
- Windows web debugging proxy
- log, examine, and modify HTTP(s) network requests and server responses successfully. In a blink of an eye, correct the mistake.
- Simple import/export of requests in different formats eliminates guesswork.
- Create personalised scripts to hasten your troubleshooting processes.
- Debug quickly and write web communication code more quickly to free up time for other things.
Capture Fiddler Trace?
- Close all browsers to avoid confusion or misunderstanding of the issue, we are going to capture/reproduce the issue to Capture Fiddler Trace on Machine.
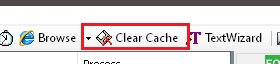
- Launch “Fiddler Classic” tool then click the Clear Cache at the top you can find this button as soon as you start Fiddler.
- Note: All the traces on your pc/machine will be captured in the backend so if you want to debug or have less traces then close the application which is not in use.
- Then click Tools at top menu bar >> then select Options
- Click the ‘HTTPS’ tab at the appeared dialog box.
- Note: Once you click/tick this option it will ask to trust some certificate so that it can have authority to capture all the traces on your pc/machine.
- Verify the options are set as shown in this below screensho.
- Confirm that the “Decrypt HTTPS traffic” option is checked
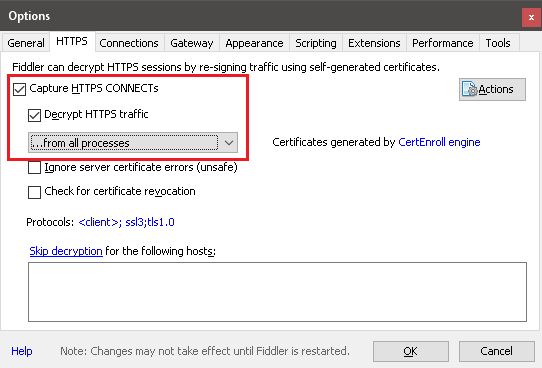
- If Fiddler prompts you up to trust the root certificates in the pop-up screen, then click ‘Yes’
- To capture the traces open the application/issue host where you are getting problem or issue. Then perform the same action to repro the issue. All the application which are involved in the issue must be traced so that we get all tokens and handshake made with in the applications.
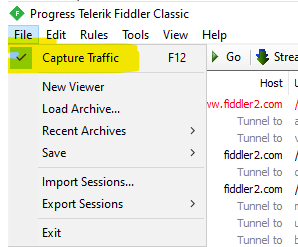
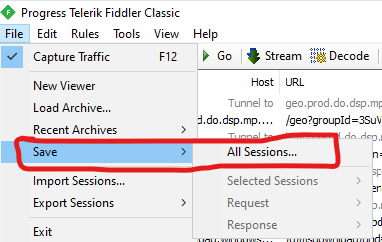
- Once all the network trace is captured, just go to File and then > uncheck the box next to Capture Traffic option.
- Click File > Save > All Sessions and send the trace file to me (.saz file) via email or upload to your private space. Now we have successfully Capture Fiddler Traces.
Fiddler Using CMD?
Please utilize these commands when the issue can be reproduced immediately, as it is most helpful in resolving connectivity issues. For performance-related concerns, we should resort to using either Netmon or Wireshark.
Also, here’s the command to stop the trace when capturing from the command prompt.
Steps:
- Open an elevated command prompt and run:
“netsh trace start persistent=yes capture=yes tracefile=c:\temp\nettrace-boot.etl” (make sure you have a \temp directory or choose another location). - Reproduce the issue.
- Open an elevated command prompt and run: “netsh trace stop”
Your trace will be stored in c:\temp\nettrace-boot.etl**or wherever you saved it. You can view the trace on another machine using Netmon.
Conclusion
Fiddler is a tool where you can capture all kind of https, http traffics to analyse the request made to certain application and websites. Fiddler widely used to debug the issue/problems is we will generally face in the network traffics.
Suppose your using your custom website and when you try to login to that account you will get some error on your screen stating account related issues, so to find out what might be the issue or error we collect fiddler to check the background process such Post, Call, Reachability and other handshake made to the website with that account is proper or not.
Related Posts!
- Run as Different User option, then you can follow this article below.
- Create Local Admin Account in any windows, follow the below article!
- Could not load folder content in SSRS/PBIRS
